
Impacts of economic activities on marine biodiversity: what measurement tools and what limits?
Introduction: Marine Biodiversity
In 2019, the Intergovernmental Science-Policy Platform on Biodiversity and Ecosystem Services (IPBES) pointed out that “Marine ecosystems, from coastal to deep sea, now show the influence of human actions; Coastal marine ecosystems show both large historical losses in terms of extent and condition as well as rapid ongoing declines”[1]. As with terrestrial biodiversity, the situation is alarming: only 13% of global marine areas are unaffected by human pressure[2], more than a third of all marine mammals are threatened, and 38% of fish stocks are overexploited[3].
The last two IBPES reports, published in 2024[4], emphasize that human activities have overexploited and degraded many marine ecosystems globally and suggest that improving the integrated management of landscapes and seascapes is one way to reverse the loss of marine biodiversity.
Earlier in September 2024, the ‘Planetary Health Check’ warned that the threshold for a seventh planetary boundary[5]-ocean acidification would soon be exceeded. Like the other planetary boundaries, this represents a physical limit beyond which the environment could be irreversibly destabilised, leading to significant and unpredictable impacts on living beings.
In 2024, the French government announced that 2025 would be named ‘The year of the Oceans’ in France. This year will feature major events, key actions, and initiatives under the banner ‘La Mer en commun’ (The Sea in common). The Third United Nations Oceans Conference (UNOC3) will be held in Nice in June 2025, with the main goal of ‘fostering urgent and expanded action to conserve and sustainably use the ocean, seas, and marine resources’.
To kick off this important year, Carbone 4 will showcase a review of the current state of knowledge on the impact of human activities on marine biodiversity, as well as tools available and their limitations.
Definition of marine biodiversity
Life on Earth began in the oceans around 3.8 billion years ago. It wasn’t until much later, around 400 million years ago[6], that life emerged on land. The seas and oceans cover nearly 71% of the Earth's surface and are home to a rich and complex biological diversity that is still not fully understood. Researchers estimate that there are 8.7 million species on Earth, including 2.2 million marine species[7]. To date, fewer than 280,000 marine species have been documented, representing only 13% of all known species on the planet[8].
In 1992, the Convention on Biological Diversity (CBD) defined biodiversity as ‘the variability among living organisms from all sources including terrestrial, marine and other aquatic ecosystems and the ecological complexes of which they are part’.
Marine biodiversity, therefore, refers to all living marine organisms, the ecosystems[9] in which they live and the interactions between species and their environment[10]. Like terrestrial biodiversity, marine biodiversity spans a wide range of ecosystems, from open water to coastal habitats (estuaries, lagoons, reefs, mangroves) or offshore habitats (plateaus, ocean plains and abyssal zones). Examples of marine ecosystems include coral reefs, which support a variety of fish, corals, mollusks and other marine species; estuaries, where freshwater from rivers meets saltwater from the oceans, creating unique habitats for fish, crustaceans and birds; and the abyssal zones, the deep, inaccessible parts of the oceans, home to species adapted to extreme conditions of pressure and temperature, such as abyssal fish, cold corals and unique invertebrates.
Marine biodiversity has several distinctive characteristics that make it particularly complex to study. These include the difficulty of accessing marine environments, the three-dimensional nature of the seas and oceans, the high mobility of marine species that can migrate over vast distances, the symbiotic relationships between species, and the complexity of marine food chains.
Why is marine biodiversity essential to human activities?
The impact of human activities on marine biodiversity
Marine biodiversity is being degraded at an alarming rate and intensity. For example, one-third of the species contributing to coral reef formations are at risk of extinction[11], and 38%[12] of the world's fish stocks are overexploited.
Human activities exert five key pressures (both direct or indirect) on marine environments:
- Overexploitation of resources,
- Destruction of natural environments,
- Climate change (warming and acidification of the oceans)
- Pollution (plastic pollution, chemical pollution)
- The introduction of invasive alien species.
Figure 1 illustrates the human activities linked to each of these pressures and highlights some of the figures and negative consequences for marine biodiversity. Since the 1970s, marine species populations have declined by approximately 56%[13].
Figure 2 – Introduction of the 4 categories of ecosystem services[14]

The ecosystem services of marine biodiversity
Marine environments are a vital component of element cycles, particularly the water cycle, where they serve as the main reservoir. The process of photosynthesis allows phytoplankton, the microscopic algae found in the oceans, to produce two-thirds of the oxygen in the atmospheric air consumed by living organisms each year. By converting nutrients in the water into biomass (a key energy source), phytoplankton form the foundation of marine food chains.
The oceans also function as a significant carbon sink, absorbing about a quarter of human-made greenhouse gas emissions. This occurs through two mechanisms: the dissolution of CO2 in the water and photosynthesis by algae. While this process helps mitigate global warming, the sequestration of large amounts of carbon disrupts marine ecosystems: the oceans warm, become more acidic and experience a decrease in dissolved oxygen levels. This shows that climatic phenomena trigger chain reactions in the marine environment, which can reinforce and amplify each other, creating a positive feedback loop.
The Dugong, an emblematic species of the pressures on marine biodiversity, whose role is essential to marine life[15]
The dugong, a marine mammal from East Africa to the Western Pacific serves as an example of a species threatened by human activities, despite its vital role in the marine environment.
The dugong faces multiple threats:
- despite hunting bans in many countries, the species continues to suffer from poaching and accidental capture in fishing nets,
- the extent of the seagrass beds it depends on is shrinking year after year,
- as a coastal species, the dugong shares its habitat with areas of heavy maritime traffic and often falls victim to fatal boat collisions.
- its coastal habitats are being reduced by tourism, pollution and coastal urbanization.
Nonetheless, the dugong plays a crucial role in maintaining healthy marine ecosystems: by consuming 30 to 40 kg of seagrass daily, it helps stir up the seabed, promoting healthy ecosystems. Its presence benefits other species such as green turtles, fish (like napoleons and humpbacks.) and halophytes. As an umbrella species, the dugong’s range offers protection to other species. Therefore, the survival of the dugong is critical not only for its own species but for the health of many marine habitats and species, with its extinction potentially triggering widespread cascading effects.
All the benefits that humanity derives from biodiversity are classified into 4 categories of ecosystem services:
Figure 1 – Pressures and impacts of human activities on marine biodiversity[16]

The consequences of the degradation of marine environments on our activities
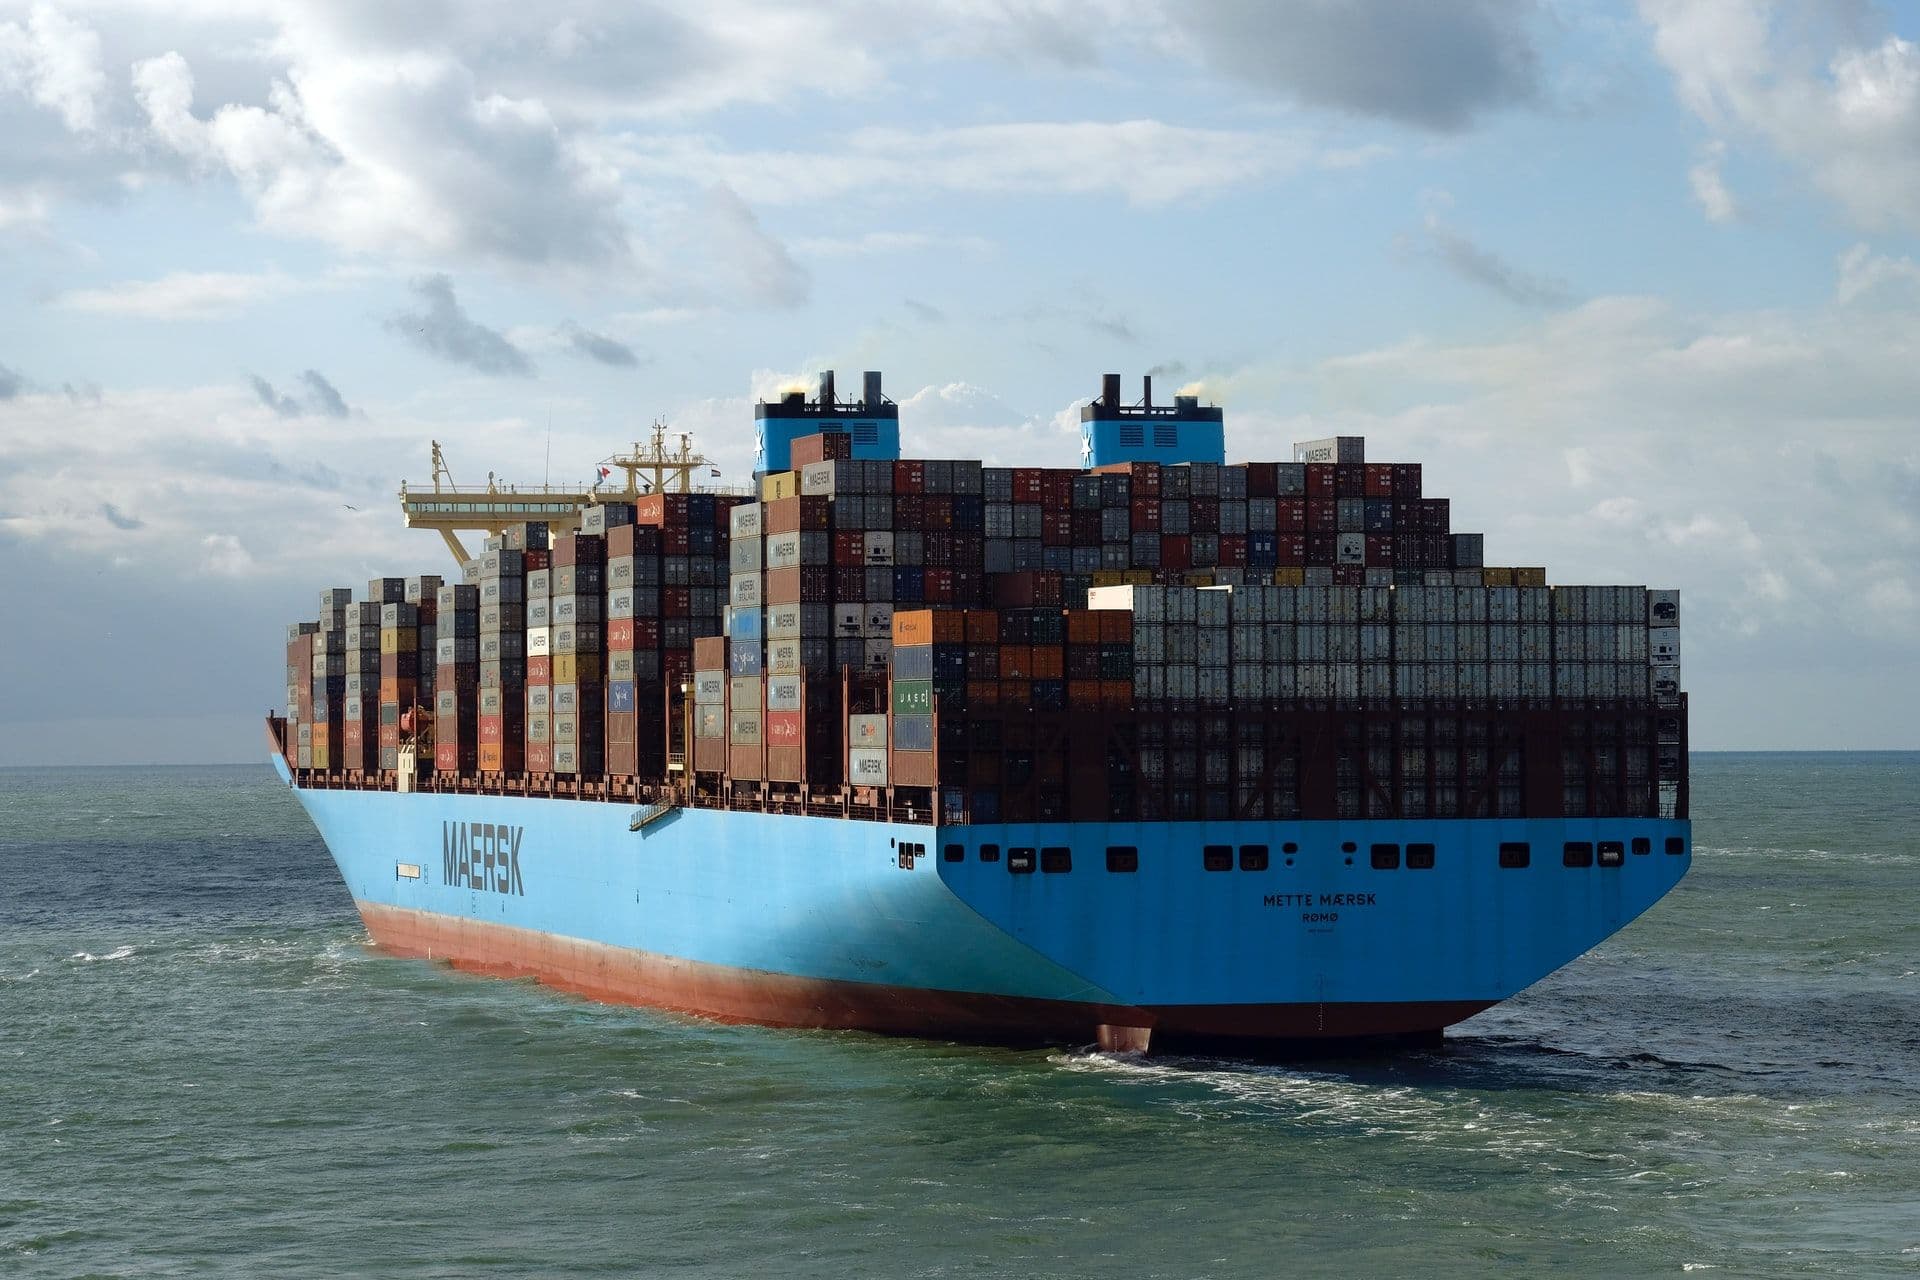
Human beings rely heavily on marine ecosystem services, the total value of which has been estimated by the WWF at 24 trillion dollars per year[17]. This gross marine product, which represents the annual economic value of the oceans, is calculated similarly to a country’s gross domestic product. It places the oceans as the 7th largest economy in the world. Several activities and assets are included in this calculation: direct production from the oceans (fish stocks, mangroves, coral reefs, seagrass beds), trade and transport (shipping lanes) and adjacent assets (coastal production, carbon absorption). It is important to note that this is a conservative estimate, as forms of production not directly generated by the oceans, like subsea oil and gas and wind power are excluded from the calculations.
Beyond the ethical concerns surrounding the degradation of marine ecosystems due to human activities, the pressures on marine biodiversity are gradually altering ecosystems, disrupting their functions, and ultimately affecting our ability to sustainably benefit from the services they provide. With population growth and improving living standards exacerbating the pressures on marine and coastal biodiversity (such as increased food demand, maritime traffic, and urban sprawl along coastlines), promoting more sustainable management practices for marine ecosystems is essential.
What frameworks are being implemented to help companies to better measure and reduce their impact on marine biodiversity?
In response to growing awareness about the need to preserve marine biodiversity, companies are being encouraged to more effectively measure, monitor, and report their impacts. International frameworks, regulations, and voluntary standards provide the structure for impact measurement, outlining requirements and best practices. These complementary frameworks are being developed simultaneously and iteratively, and they are essential for defining robust biodiversity strategies.
International framework and regulations
At the end of 2022, the Kunming-Montreal Global Biodiversity Framework (GBF) solidified international commitment to protecting marine biodiversity. It set two key targets to address ecosystem degradation: ensuring that at least 30% of degraded marine and coastal ecosystems are effectively restored by 2030 (Target 2) and ensuring that at least 30% of marine and coastal areas are adequately conserved and managed through the establishment of protected areas by 2030 (Target 3).
The IPBES Nexus Assessment report supports this framework by proposing 71 potential actions to preserve the interconnections between biodiversity, water, climate change, food, and health. These responses are categorized into 10 areas, each associated with one or more GBF targets.
Simultaneously, the European Union's corporate sustainability regulations, such as the Corporate Sustainability Reporting Directive (CSRD), impose specific reporting obligations on the management of marine resources, through the ESRS E3 - water and marine resources. These ESRS E3 requirements highlight the interactions between human activities and marine biodiversity.
What do companies subject to ESRS E3 have to publish?
The ESRS E3 is one of the CSRD thematic standards, and its reporting obligation is determined by the results of the dual materiality analysis. If the 'marine resources' theme is identified as material for the company—meaning it represents a significant challenge in terms of impact materiality (the effects of the company's activities on marine ecosystems) and/or financial materiality (the effects of marine ecosystems and their evolution on the company's economic performance)—the company is required to publish the following information:
- Process for identifying the impacts, risks and opportunities (IROs) associated with marine resources (methodology, results),
- Policies in place to manage these IROs, particularly in terms of water management (use of marine resources, pollution of the oceans, water treatment), integration of the issue of preserving marine resources into the design of the company's products and services,
- Means allocated to avoid and/or reduce the use of marine resources,
- Targets set for the sustainable management of marine resources,
- Monitoring indicators (e.g. quantities of marine resources used by type),
- Quantification of the financial impact of IROs for the company.
Voluntary and international initiatives
Voluntary standards are also being developed to help companies better manage their impacts on marine biodiversity.
The Task Force on Nature-related Disclosures (TNFD) and the Science-Based Targets Network for Nature (SBTN) have created guidelines to assist companies in defining their biodiversity strategy, from assessment to reporting. Specifically, SBTN offers a guide for setting a company’s marine biodiversity objectives. Additionally, the Partnership for Biodiversity Accounting Financials (PBAF) standards enable financial institutions to evaluate the impacts and dependencies of their loans and investments on biodiversity, allowing them to effectively manage risks and opportunities, report on these issues, and promote investments that support biodiversity.
International stakeholders are coming together to address marine biodiversity issues collectively, with many initiatives already underway. Carbone 4 has identified more than 54 national and international initiatives since 2015, led by a diversity of players: NGOs (24), intergovernmental bodies or governments (17), research institutions (10) or even the private sector (7). This highlights the increasing significance of the issue. For example:
Since 2008, an international partnership has formed around the Global Ocean Biodiversity Initiative, working to implement the principles of the Convention on Biological Diversity (CBD),
In 2021, the United Nations launched the Decade of Ocean Sciences for Sustainable Development (2021-2030), aiming to accelerate scientific advancements to better understand and protect the oceans[18],
In 2021, Ifremer and CNRS launched a Priority Research Programme on ‘Ocean and Climate’ in France to deepen knowledge of the marine environment,
In 2021, the Fondation de la Mer, in collaboration with the Ministry of the Sea and BCG, introduced the Référentiel Océan and the Ocean Approved label. These tools, based on the UN Sustainable Development Goals, are designed to analyse, reduce and monitor the impact of companies on the ocean[19],
At the end of 2024, the Convention des Entreprises pour le Climat (Businesses Convention for Climate) introduced an Ocean pathway focused on developing sustainable strategies to support the energy transition within the maritime sector.
How do companies measure their impact on marine biodiversity?
What tools exist to help economic players measure their impact on the marine environment?
As international stakeholders increasingly work to protect marine environments, what tools are available to help measure their impacts? To assess the current state of tools for measuring the impact of economic activities on biodiversity, Carbone 4 conducted an analysis of existing tools, which is summarized below.
Out of the 141 tools, metrics, indicators, and data layers identified by Carbone 4, 89 are state of nature indicators not directly related to human pressures, 36 measure pressures without linking their effects to ecosystem health, and 9 tools, currently under development, incorporate the pressure-state relationship specifically for the marine environment.
The limits of existing tools
Tools for measuring the impact of economic activities on biodiversity, particularly marine biodiversity, are still evolving. This is primarily due to the challenges of obtaining a comprehensive and consolidated view of biodiversity issues across an organization’s global operations, a lack of scientific knowledge about marine biodiversity, and the dynamic nature of marine ecosystems. Unlike carbon, which has a well-established and widely used global metric (the ton of CO2 equivalent), a range of metrics is necessary to capture the various dimensions of biodiversity: (1) ecosystems (the condition, structure, and function of ecosystems), (2) species (the risk of species extinction), and (3) genetic diversity. The concept of equivalence, which works well in the climate context, is complicated when applied to biodiversity, as each ecosystem has unique properties. However, metrics like the MSA (Mean Species Abundance) [20], derived from the GLOBIO model, and the PDF (Potential Disappeared Fraction of species), based on life cycle analysis, are used to measure the condition of ecosystems via different methods for assessing impacts of businesses on biodiversity.
Currently, existing tools are more effective at addressing impacts on terrestrial and aquatic ecosystems than on marine ecosystems. SBTN highlights the variability in the availability and quality of data on marine systems, which can depend on factors such as fish stock location, the size of fisheries (industrial or small-scale), and local regulations. For instance, the Global Biodiversity Score (GBS), a biodiversity footprint tool developed by CDC Biodiversité and used by many organizations, can assess the impacts of economic activities on aquatic and terrestrial biodiversity, but it does not yet include a specific indicator for marine biodiversity. However, certain pressures, such as overfishing, are beginning to be factored into the tool. While frameworks and tools provide indicators for monitoring marine biodiversity pressures, they do not yet allow companies to set and track a quantified trajectory for these impacts. Establishing such a trajectory would be helpful for companies to monitor and steer their impacts over time, much like a climate trajectory.
Table 1 : Analysis of databases and models associated with marine biodiversity (non-exhaustive list)
Name | Type | Scope | Organisation | Description | Pros | Cons |
|---|---|---|---|---|---|---|
| ENCORE | Database | Approach based on pressures and potential dependencies
| UNEP-WCMC, Global Canopy, UNEP-FI | A database that allows for a qualitative diagnosis of sectoral impacts and dependencies related to a given production process on biodiversity.
| Easy to use and freely accessible, covers some pressures on marine biodiversity. | No link between pressures and impacts on the state of nature (only qualitative analysis). |
| IBAT | Mapping tool | Risk to the state of nature (including extinction risk) | International Union for Conservation of Nature (IUCN), UNEP-WCMC, Birdlife, Conservation International | A mapping tool to identify the interfaces of an organization’s sites with biodiversity from GPS coordinates. | Covers many biodiversity hotspots (e.g., Key Biodiversity Areas, protected areas, Natura 2000) and threatened marine species. | License required for use, does not quantify the organization’s impacts. Partial coverage for marine species. |
| Marine Species Threat Abatement and Restoration (marine STAR) | Metric | Pressure-Impact (on extinction risk) | IUCN | A measure to determine whether an organization’s actions can help curb biodiversity loss and reduce the extinction risk of species in oceans and seas. | Context-specific, localized data, diagnostic tool. | Does not cover ecosystems, does not cover all taxonomic groups, not yet adaptable for action plans (in development). |
| WWF Biodiversity Risk Filter | Database | Risk to the state of nature (including extinction risk) | WWF | A risk analysis tool based on GPS coordinates of the organization, considering the state of nature and ecosystem services near the sites. | User-friendly tool, integrates marine ecosystem degradation and marine resource availability. | Macro-scale analysis and results: extraction provides a broad view of risks but not granular (e.g., the names of key biodiversity areas near sites are not provided), does not quantify the organization’s impacts. |
| Ocean+ | Database | State of nature (extent and condition of certain marine and coastal ecosystems) | UNEP-WCMC | Mapping tools to visualize data on the state of marine and coastal ecosystems and marine biodiversity. | Covers several key marine and coastal ecosystems (e.g., mangroves, coral reefs, seagrass meadows) and biodiversity hotspots. | Does not quantify the organization’s impacts. |
| UNBiodiversity Lab | Database | State of nature (extent and condition of certain ecosystems) or pressures | UNEP | Mapping tool to visualize data on the state of marine and coastal ecosystems. | User-friendly tool, includes data on cumulative human activity impacts on marine ecosystems, the state and condition of certain ecosystems. | Does not quantify the organization’s impacts, no link between pressures and impacts on the state of nature. |
| Hub Ocean | Database | State of nature (extent and condition of ecosystems) or pressures | Hub Ocean | A collection of ocean databases and mapping tools. | Allows monitoring of ocean health, coral reefs, ship emissions. | Does not quantify the organization’s impacts. No link between pressures and impacts on the state of nature. |
| Waterbase | Database | State of nature (extent and condition of ecosystems) or pressures | European Envrionment Agency (EEA) | European database on aquatic and marine environments, integrating aspects related to coastlines, seas, and oceans. | Integrates the impact of climate change. | Focuses mainly on climate change impacts (without linking to marine biodiversity impacts), does not quantify impacts on the relevant zones. |
| EMODnet | Database | State of nature or pressure | European Commission | Harmonized geographical data on marine habitats, species distribution, and anthropogenic pressures. | Habitat and species mapping. | Limited to the Mediterranean, does not link pressures and impacts. |
| Impact World + | Model | Pressure-Impact (partial coverage) | International Reference Centre for Life Cycle Analysis and Sustainable Transition (CIRAIG) | Model to estimate the impacts of activities on biodiversity based on life cycle analysis methodology, expressed in PDF. | Uses an aggregated indicator, covers marine acidification, marine eutrophication, ecotoxicity, fisheries impact. | Does not consider all pressures on marine biodiversity (habitat destruction, ocean warming, etc.). |
| ReCipe | Model | Pressure-Impact (partial coverage) | National Institute for Public Health and the Environment – The Netherlands | Model to estimate the impacts of activities on biodiversity based on life cycle analysis methodology, expressed in PDF. | Uses an aggregated indicator, covers marine ecotoxicity and marine eutrophication. | Does not cover certain marine biodiversity pressures (e.g., direct species exploitation, climate change impact on marine biodiversity), simplifies the pressure-impact relationship with average data (source of uncertainty, model development halted since 2017). |
| Biodiversity Footprint for Financial Institutions (BEFI) | Model | Pressure-Impact (partial coverage) | Pré, CREM, RVO | Method to estimate the impacts of financial organizations on biodiversity, based on the ReCipe model. | Same as ReCipe. | Same as ReCipe. |
| LC-Impact | Model | Pressure-Impact (partial coverage) | European Project with several universities and companies | Spatialized impact assessment model for products or services throughout their life cycle in 3 areas (human health, ecosystem quality, resources). | Uses spatialized and aggregated characterization factors at the national/international levels, covers marine ecotoxicity and marine eutrophication. | Does not cover direct species exploitation, direct activity impacts at sea, certain marine biodiversity pressures (acidification, climate warming). |
| GLOBIO | Model | Pressure-Impact (partial coverage) | PBL Netherlands Environmental Assessment Agency | Model to assess the impacts of an organization on biodiversity, expressed in MSA. | Widely used and recognized model, uses an aggregated indicator. | Does not yet include a module for marine biodiversity. |
| Global Biodiversity Score (GBS) | Model | Pressure-Impact (partial coverage) | CDC Biodiversité | Model to assess the dependencies and impacts of an organization on biodiversity along its value chain. | Measures the impact of activities on biodiversity through an aggregated indicator (MSA). | Does not yet include a module for marine biodiversity (in development). |
| Biodiversity Impact Analytics (BIA-GBS) | Database | Pressure-Impact (land coverage) | Carbon4 Finance, CDC Biodiversité | Database to assess an organization's dependencies and impacts on biodiversity | Same as GBS. | Same as GBS. |
| Corporate biodiversity footprint | Database | Pressure-Impact (land coverage) | Iceberg Datalab, I Care by BearingPoint | Model to assess the dependencies and impacts of an organization on biodiversity, expressed in MSA. | Uses an aggregated indicator. | Does not yet include a module for marine biodiversity. |
GID Biodiversity Impact data & Biodiversity Navigator | Model | Pressure-Impact (land coverage) | Impact Institute | Model to assess the impacts and dependencies of an organization, its investment portfolio, and value chain on biodiversity. | Covers climate change. | Does not yet include marine biodiversity pressure, paid tool. |
Conclusion
As awareness grows about the impact of human activities on marine biodiversity and our dependence on it, both binding and voluntary frameworks are being developed to encourage organizations to better measure, monitor, and manage their impacts.
Simultaneously, tools are being created to help organizations analyze their impact on biodiversity. Companies now have access to international databases that provide information on the state and nature of marine biodiversity in specific areas and explore the interfaces between their activities and these regions. This allows for the prioritization of actions to reduce impacts on sites near important marine biodiversity areas (e.g., protected areas, Natura 2000 sites, etc.). The ENCORE database can also be used to qualitatively assess the sectoral impacts and dependencies associated with specific production processes on marine biodiversity. To complement these databases, models are being developed to estimate the impact of economic activities on biodiversity. While these models enable the calculation of indicators for a company's impact on both terrestrial and aquatic biodiversity, they often do not fully address marine biodiversity impacts.
In summary, current tools are insufficient in covering the impacts of economic activities on marine biodiversity. There is a clear need for further methodological development to enable companies to better measure their marine biodiversity impacts and identify strategies for reducing them.
In 2025, France will celebrate the Year of the Sea and host the 3rd United Nations Oceans Conference (UNOC3). We can only hope that the initiatives in progress will inspire businesses to tackle this issue and reduce their impacts on marine biodiversity. Carbone 4, Ifremer, and CDC Biodiversité are launching an initiative to help companies assess their pressures on biodiversity and develop action plans to mitigate them. Please feel free to contact us if you're interested in these topics or have any questions.
Other resources that might interest you


Contact us
Contact us about any question you have about Carbone 4, or for a request for specific assistance.
